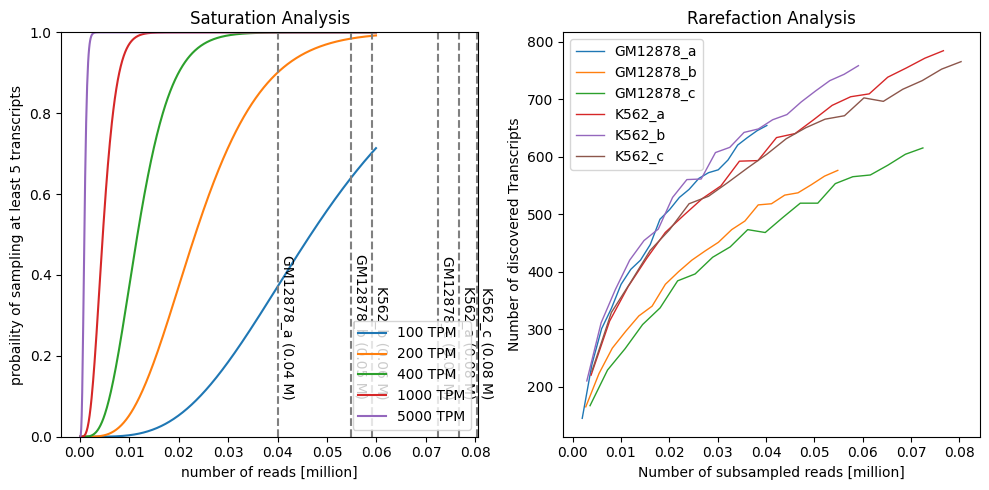
Saturation analysis
IsoTools provides two approaches to assess the required depth of sequencing:
Saturation analysis:
Models the propability of observing a transcript with at least n reads.
Depends on the expression level on the transcript
E.g.: “With the given seq depth, the probability of observing a 1 TPM transcript is > 80%”
Rarefaction analysis
Subsamples the reads and counts the number of observed transcripts.
Helps estimating, how much more transcripts would be observed with deeper sequencing.
If the curve is relativly flat towards the right, deeper sequencing would yield little additional transcripts.
Can be restricted to a subset of transcripts (e.g. only matching reference annotation or only novel genes)
The following steps assume you have run the previous tutorial, or downloaded the prepared transcriptome pkl file PacBio_isotools_substantial_isotools.pkl from the demonstration dataset.
[1]:
from isotools import Transcriptome

path='demonstration_dataset'
isoseq=Transcriptome.load(f'{path}/PacBio_isotools_substantial_isotools.pkl')
This is isotools version 0.3.2rc3, but data has been pickled with version 0.3.2rc2, which may be incompatible
[2]:
from isotools.plots import plot_saturation, plot_rarefaction
import matplotlib.pyplot as plt


plt.rcParams["figure.figsize"] = (10,5)
fig, axs=plt.subplots(1,2)

plot_saturation(isoseq,cov_th=5, expr_th=[100, 200, 400, 1000, 5000],x_range=(1e2,6e4,1e2), ax=axs[0])

rarefraction, total=isoseq.rarefaction(min_coverage=2, tr_filter={'query':'FSM'})
plot_rarefaction(rarefraction, total=total, ax=axs[1])

fig.tight_layout()

[ ]: